Khushi Nigam
Driving Business Success Through Data
I collect, analyze, and visualize data — empowering smarter decisions and creating meaningful impact for teams and organizations.
See my portfolio
I collect, analyze, and visualize data — empowering smarter decisions and creating meaningful impact for teams and organizations.
See my portfolio
Hi! I'm Khushi Nigam, a BCA graduate with a deep passion for turning raw data into meaningful business insights. I’ve worked on hands-on projects in domains like e-commerce, HR, and sales analytics, etc. I love solving real-world problems and continuously learning new ways to use data effectively.
A blend of technical and analytical skills that help me transform data into business value.
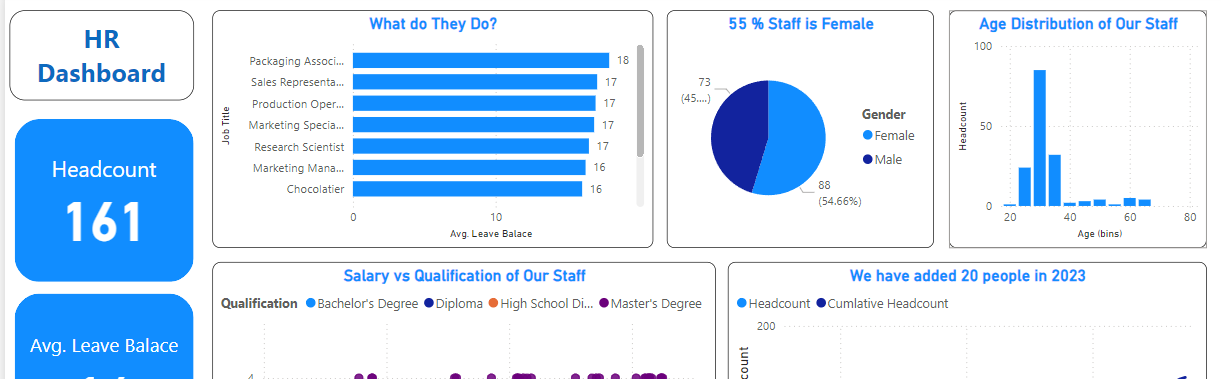
Built using Power BI and Excel to analyze employee attrition, performance, and departmental trends. Provided insights into workforce demographics, staff distribution, and salary structure to support HR decisions.
View Project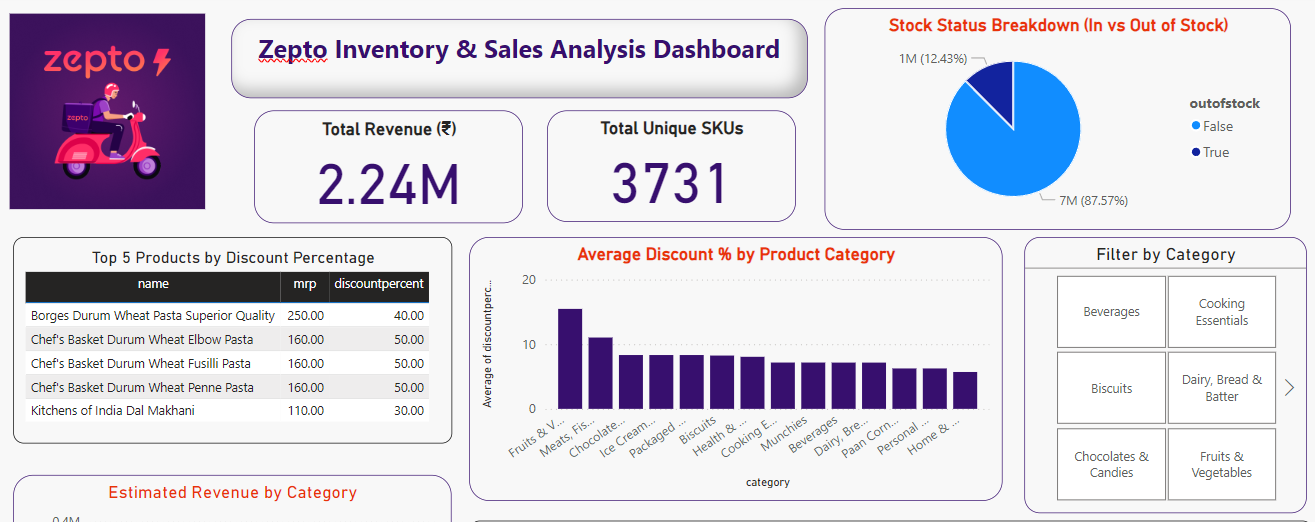
This project showcases a complete SQL + Power BI analysis pipeline using a real-world e-commerce inventory dataset inspired by Zepto. It highlights product pricing, discount patterns, etc for better business decision-making.
View Project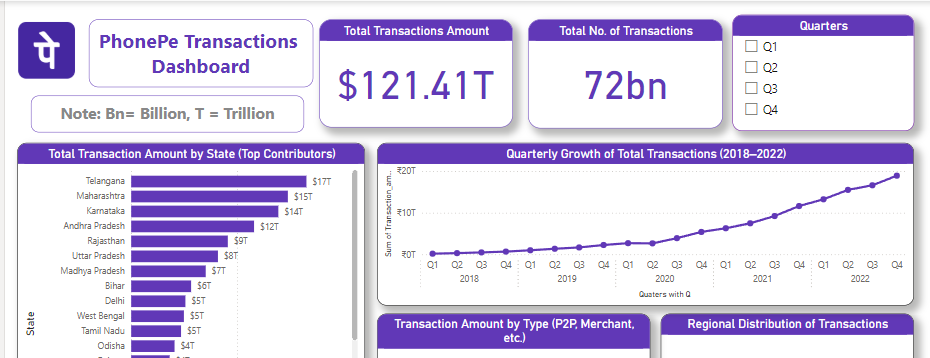
Created an interactive dashboard in Power BI to visualize transaction volume, value, and state-wise growth using Excel data.
View Project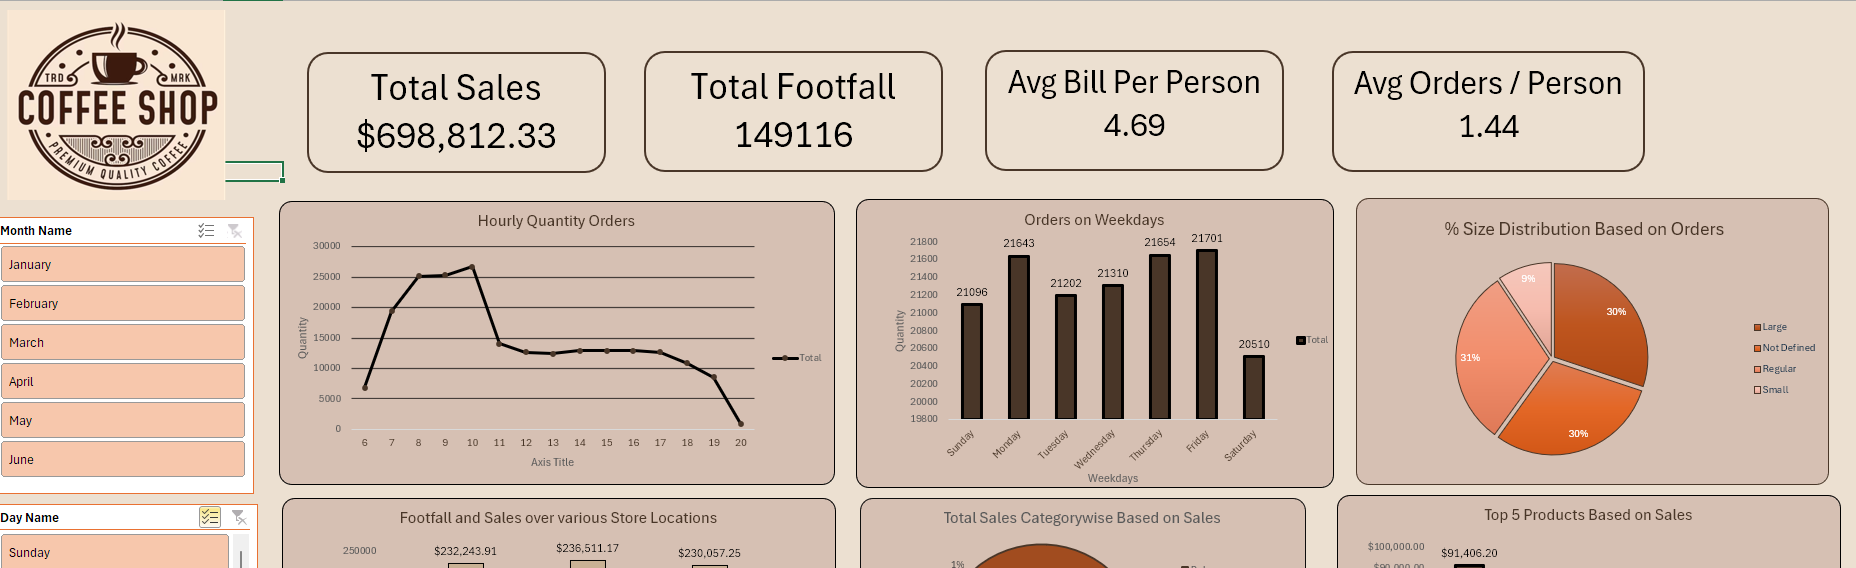
Used Excel to explore sales trends, peak hours, and product-wise performance for better business insights.
View Project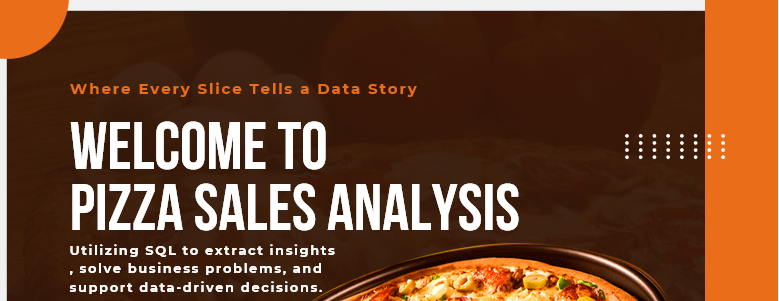
Performed SQL queries to analyze top-selling pizzas, revenue trends, and order patterns from raw sales data.
View Project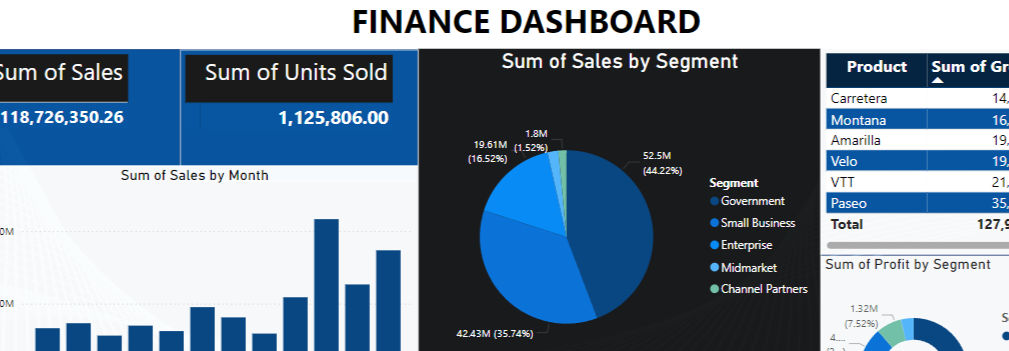
Used Excel and Power BI to assess financial performance, forecast trends, and generate actionable investment insights.
View Project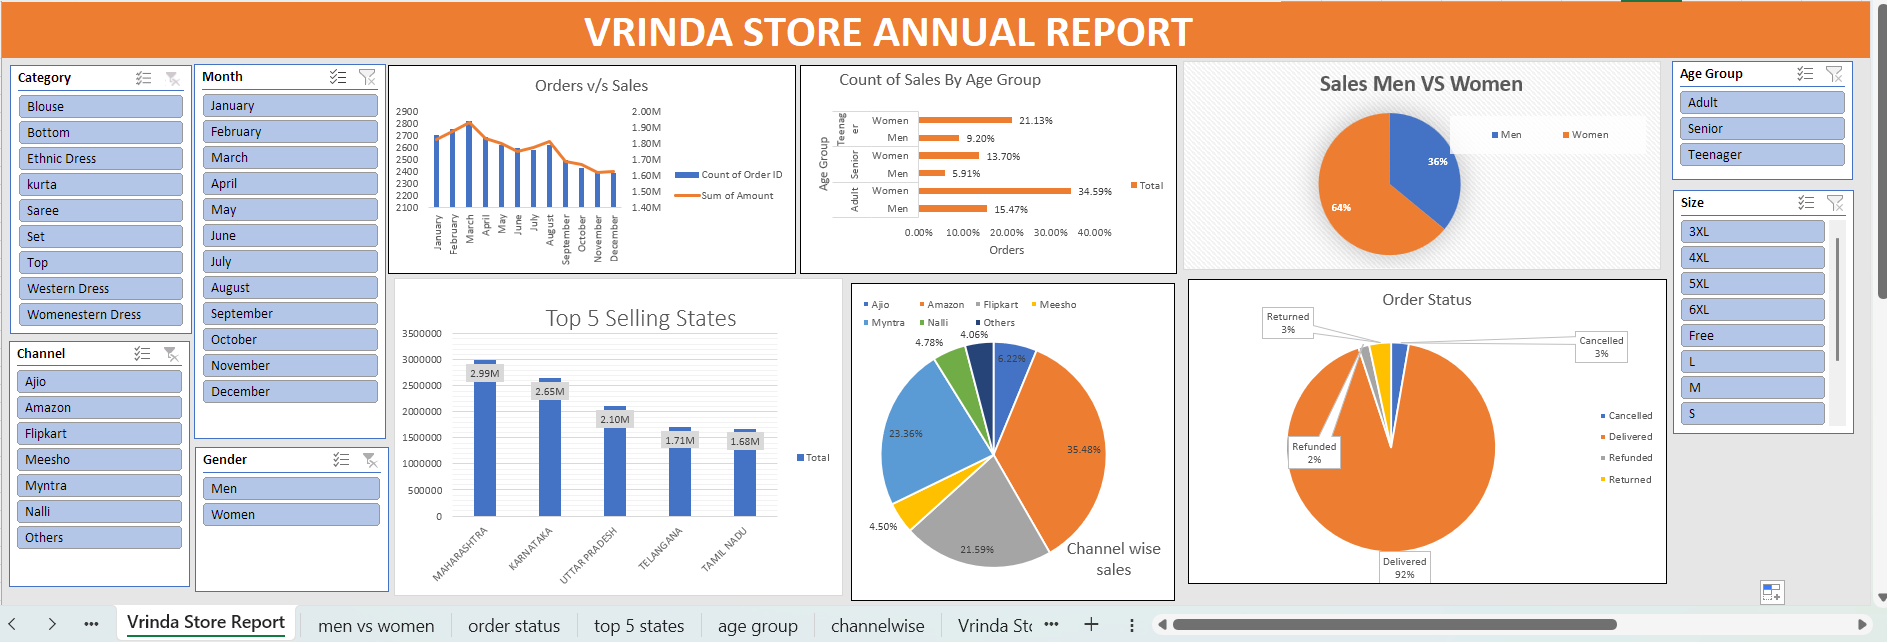
Analyzed product-wise and monthly sales performance for Vrinda Store using Power BI, highlighting top categories and revenue trends.
View Project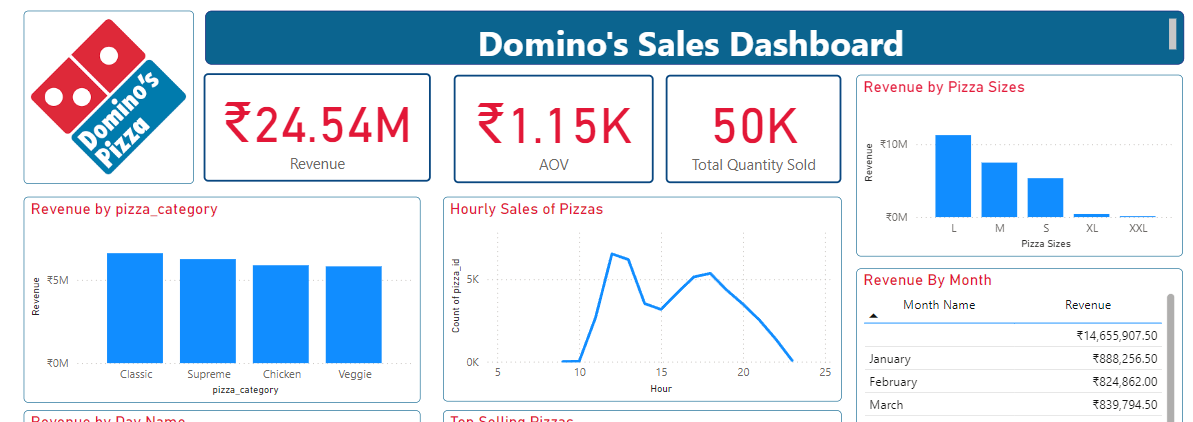
Analyzed category-wise and monthly sales performance for Dominoes using Power BI, highlighting top categories and revenue trends.
View Project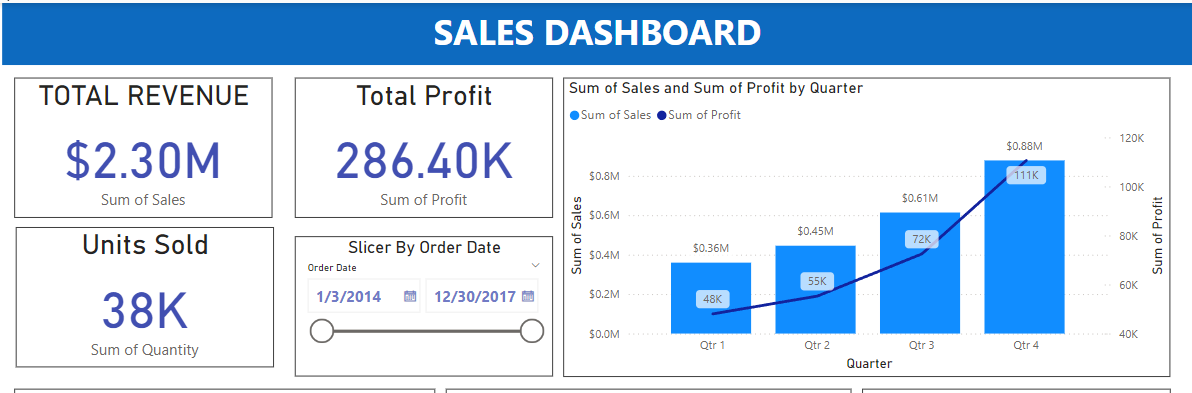
The Sales Insights Dashboard empowers businesses to make data-driven decisions. By understanding sales trends, customer behavio, organizations can optimize their sales strategies and maximize revenue.
View Project
Developed as part of my final year BCA project , this web-based application allows job seekers to browse and apply for job openings, while employers can post job listings and manage applications.
View Project
• Analyzed and cleaned client data to identify performance issues.
• Built data-driven recommendations using Excel and PowerPoint.
• Presented insights in a simulated client-facing environment.
• Solved stakeholder-focused challenges using Excel and Tableau.
• Completed consulting tasks like analyzing business cases and visualizing data.
• Earned a Deloitte certificate and reviewed model answers for feedback.
Covered fundamentals of business analysis, including requirement gathering, stakeholder analysis, user stories, and basic process modeling.
View CertificateLearned to use ChatGPT and AI tools to automate daily professional tasks, improve productivity, and enhance workflow efficiency.
View CertificatePracticed SQL concepts like joins, filters, subqueries, and aggregations to analyze business data and generate useful insights.
View CertificateExplored Agile concepts, Scrum practices, user stories, and JIRA usage for managing project requirements and team collaboration
View CertificateLearned How Generative AI helps Business Analysts in their day to day work from stakeholder communication to structured documentation
View Certificate